

Over the past few years, the number of cities adopting dedicated heat action plans (HAPs) has surged. In our new international evaluation of plans, we identified fewer than two new adoptions per year through the 2010s. In 2024 alone, we identified 15.
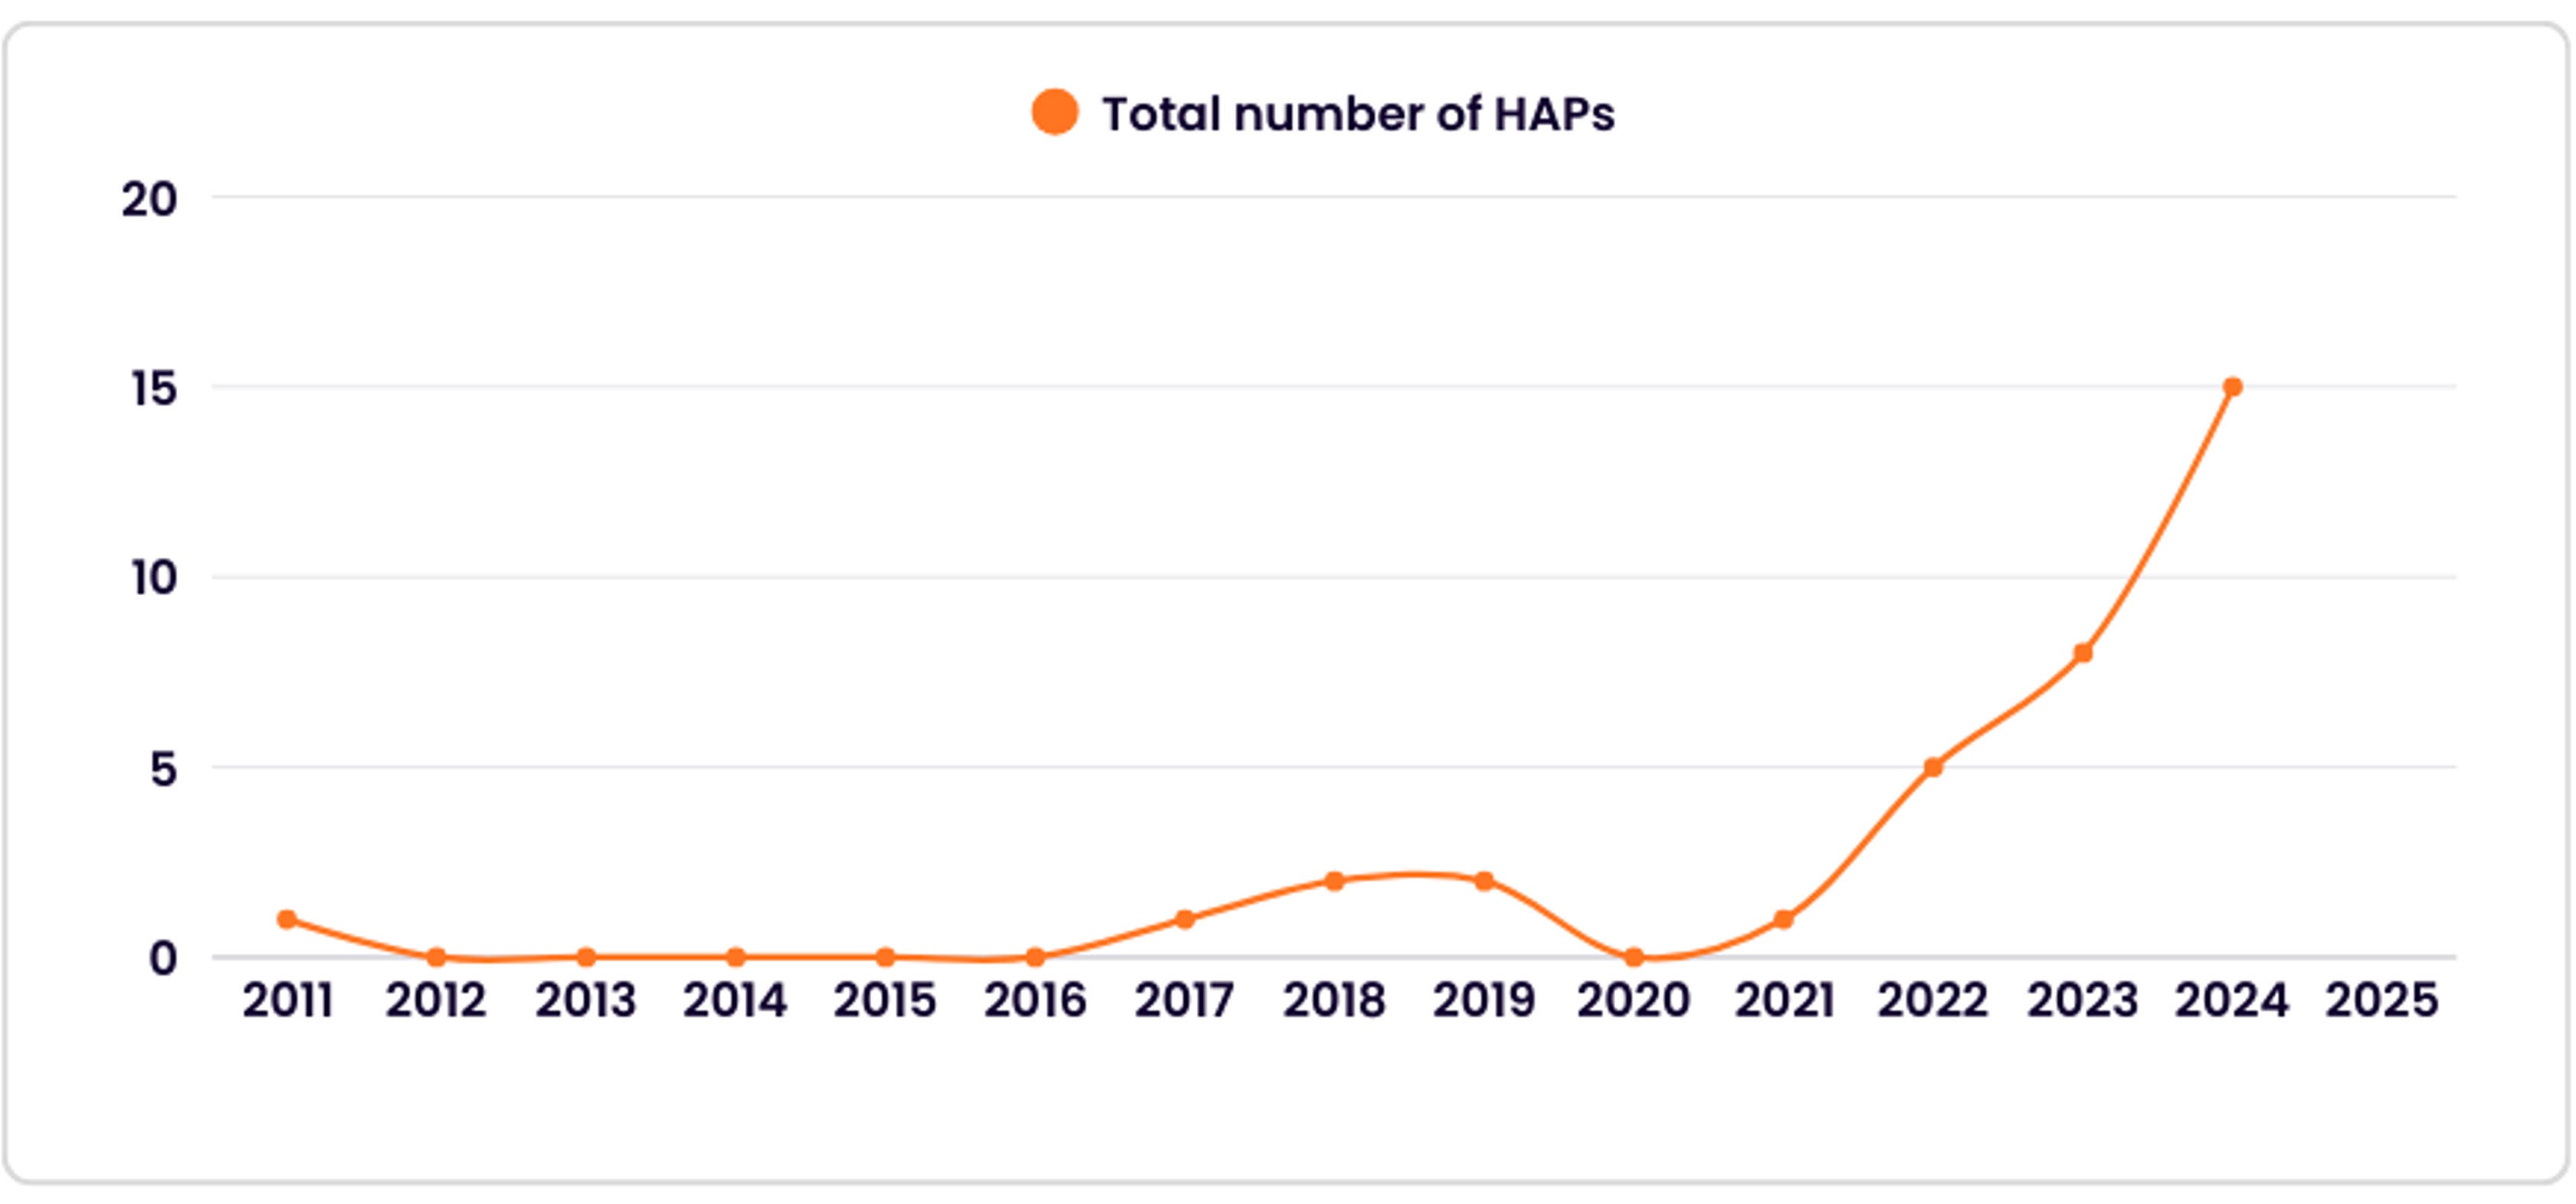
Despite this momentum, systematic evidence on whether these plans actually reduce harm is rare. If heat researchers and practitioners are going to succeed in justifying sustained funding to tackle one of the world’s deadliest climate hazards, the field needs to show interventions produce measurable results.
That is the key takeaway of a new report I co-authored with Saeideh Sobhaninia, Sara Meerow, Halley Hughes, Maryam Shafiee Shakib, Alekzander Ryan, and Caroline Webster for the Red Cross Red Crescent Global Disaster Preparedness Center. We thematically coded 34 local HAPs worldwide, evaluated 12 in depth using our 56-criterion Plan Quality Evaluation for Heat Resilience approach, interviewed officials managing 11 of them, and developed and piloted an evaluation tool in four cities. We found that while cities are tracking HAP activities, they are not tracking outcomes.
Tracking outputs instead of outcomes
Around half of the cities we interviewed already have a formal monitoring process, which is a good start. Those systems most often tracked whether strategies were implemented, though, not outcomes like whether temperatures were reduced or heat-related illnesses and deaths declined.
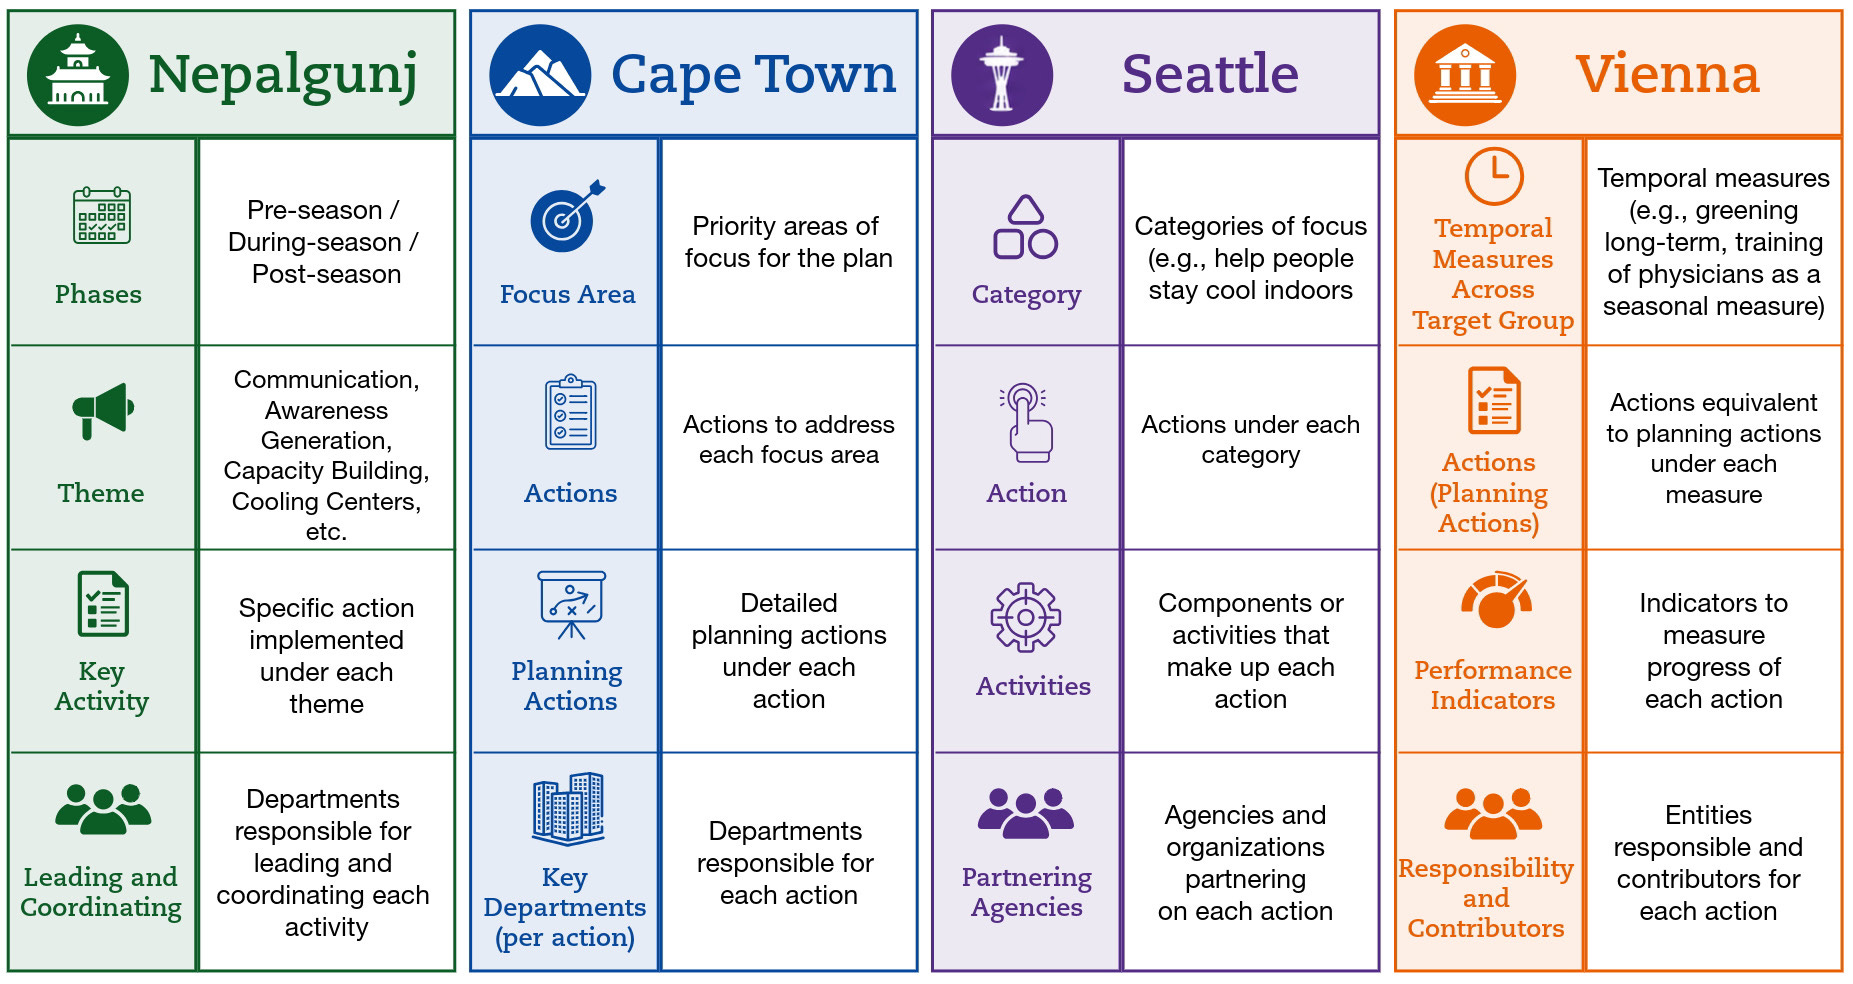
Vienna has perhaps the most mature evaluation process in our sample. Each year, city agencies responsible for the plan’s 29 measures complete detailed questionnaires, four working groups review the findings, and every measure receives a traffic-light rating for implementation and effectiveness before the plan is updated. It’s a great model for keeping their plan alive.
Yet Vienna officials acknowledged that these qualitative effectiveness ratings can be hard to link to actual outcomes. It sounds like a success if 10,000 people visit a cooling center during a heatwave. Without knowing who visited, where they came from, and what would have happened to them otherwise, though, it’s difficult to demonstrate that actual heat risk decreased.
Vienna’s model also requires more capacity than many cities have. Most municipal heat efforts operate on constrained budgets, and as staff in Miami-Dade County told us, the immediate pressure is to demonstrate activity. An hour spent on evaluation is an hour not spent supporting a cooling center or distributing box fans, so cities replicate programs without knowing which ones work.
Even where the capacity for evaluation exists, measurement is still difficult. An official from King County, Washington, described a dilemma with heat-health data. If interventions successfully reduce severe heat-related illness, the total number of relevant medical records shrinks, and U.S. privacy rules trigger data suppression. The county then loses the spatial resolution needed to see where vulnerable residents are still falling through the cracks. It’s a classic policy paradox: the more successful an intervention is, the more it degrades the outcome data policymakers rely on to justify and target future investments.
What the plans don’t say
During our fieldwork, co-authors Halley Hughes and Alekzander Ryan traveled from Tucson, Arizona, to Cape Town, South Africa, to meet with the team behind the city’s High Heat Day and Heat Wave Action Plan. Cape Town appointed a Chief Heat Officer in 2025, and their plan notes that measurable indicators are still under development.

Conversations with local officials revealed why aggregated heat data can also be misleading without local knowledge. Public cooling resources, such as libraries, municipal pools, and shaded parks, remain distributed along historic spatial lines established under apartheid, placing them farthest from the informal settlements that experience the highest surface temperatures. Emergency vehicles often can’t navigate the dense, unpaved street networks of informal settlements. Emergency calls for those areas don’t show low volume because residents don’t need help, the low volume only shows that residents have stopped calling because they know the ambulances can’t reach them. Relying on HAP outputs like a citywide average of cooling access or emergency responses could obscure those inequities.
Building comparisons into the process
Because local heat risk and governance capacities vary so widely globally, we wanted to go beyond a simple list of metrics for HAP effectiveness. The Heat Action Plan Implementation and Effectiveness (HAPIE) Tool guides city staff through their own strategies, aligns them across the eight strategy domains from Planning for Urban Heat Resilience, plus a new strategy domain for heat governance. The HAPIE tool leads to two metrics for each strategy:
An implementation measure: A simple count of plan outputs (e.g., number of cooling centers opened, shade structures installed, or outreach texts sent).
An effectiveness measure: An outcome paired with an explicit comparison group (e.g., emergency calls in neighborhoods with activated cooling centers compared to demographically similar neighborhoods without them during the same event).
Including the baseline or comparison case is a practical way to demonstrate whether the plan made a difference.
We know this can work because the few studies that have done it have shown its value. A 2018 study of Ahmedabad's Heat Action Plan estimated that roughly 2,380 deaths were avoided across the two heat seasons after implementation, with the largest reductions on the hottest days. Similarly, a Red Cross survey found that respondents shown heat interventions were more than twice as likely to have changed their behavior as respondents from control wards. The impact was more clear because the comparison was built in.
For practitioners developing or updating a HAP right now, I recommend starting small. Take three to five of your highest-priority actions. For each one, write down the output you will measure, the outcome you expect to effect, and the specific baseline or comparison group you will evaluate that outcome against. If you can’t define a baseline or comparison group, that’s your evaluation gap.
The full report and the HAPIE tool are open-access and available to download. Cities that show how their HAPs are advancing heat resilience will be the ones with the best case for sustained funding.
— Ladd
One of the challenges with evaluating HARS is the problem of "measuring nothing" we often face in public health. As someone who tracks ambulance dispatches, ER data, and mortality in near-real-time during extreme heat events, what we find is that nothing very dramatic is happening. That's exactly what we want to see and the the most important thing to measure, IMO. However, people will always raise the counterfactual and question whether the interventions are actually responsible for keeping the measurable health impacts low. Granted, we have not had another 2021-type event. Even so, we've had some stretches of very hot weather since implementation of the provincial HARS in 2022, and none have been associated with sustained and measurable stress on our healthcare systems.